




Every 100 ms of waiting costs an eCommerce conversions, costs content its Google rankings, and costs you your users' patience. Google's studies have been repeating it for years, and Core Web Vitals turned it into a ranking factor. Performance is not a cosmetic improvement: it's business.
And yet most teams optimize blindly: they change things "that should help", glance at load time once a month and never know whether they moved the needle. This is the guide we use at HexagonalGuru to audit and speed up web applications — with Symfony/PHP examples, though the principles apply to any stack.
Rule Zero: Measure Before You Touch
Optimizing without measuring is wall tuning: you notice it in the bill, not in the experience. Before changing a single line, establish the baseline:
- On the server: the Symfony profiler in development, Blackfire or Tideways in production, and the database slow query log. That's where 80% of the surprises live.
- In the browser: Lighthouse and PageSpeed Insights for lab data, and RUM (Real User Monitoring) to know what your actual users experience — not your MacBook on fiber.
- The metrics that matter: LCP (when the main content appears), INP (when the page responds to interaction) and CLS (how much the layout jumps). These are the Core Web Vitals Google measures.
With a clear baseline, attack the real bottleneck. The order of the following sections is, by audit statistics, where the problem usually hides.
1. The Database: The Classic N+1
The most common performance problem we find isn't "slow PHP" or "heavy framework": it's the database receiving hundreds of queries per request. The N+1 pattern:
// N+1: one query for the orders... and one per order
$orders = $em->getRepository(Order::class)->findAll();       // 1 query
foreach ($orders as $order) {
    echo $order->getCustomer()->getName();                   // N queries
}
The fix is usually one line: fetch the relations in the same query.
// A single query with JOIN
$orders = $em->createQueryBuilder()
    ->select('o', 'c')
    ->from(Order::class, 'o')
    ->join('o.customer', 'c')
    ->getQuery()
    ->getResult();
And its usual companions:
- Indexes. A column in a
WHEREor aJOINwithout an index turns a millisecond query into a scan of millions of rows.EXPLAINis your friend. - Pagination. No listing should return 50,000 rows.
LIMIT+ cursor, always. - Projections. If you only need three columns for a listing, don't hydrate forty full entities: use DTOs or partial queries.
2. Caching: The Optimization That Actually Scales
The fastest request is the one that never reaches your application. Think of caching as layers, from closest to the user to deepest:
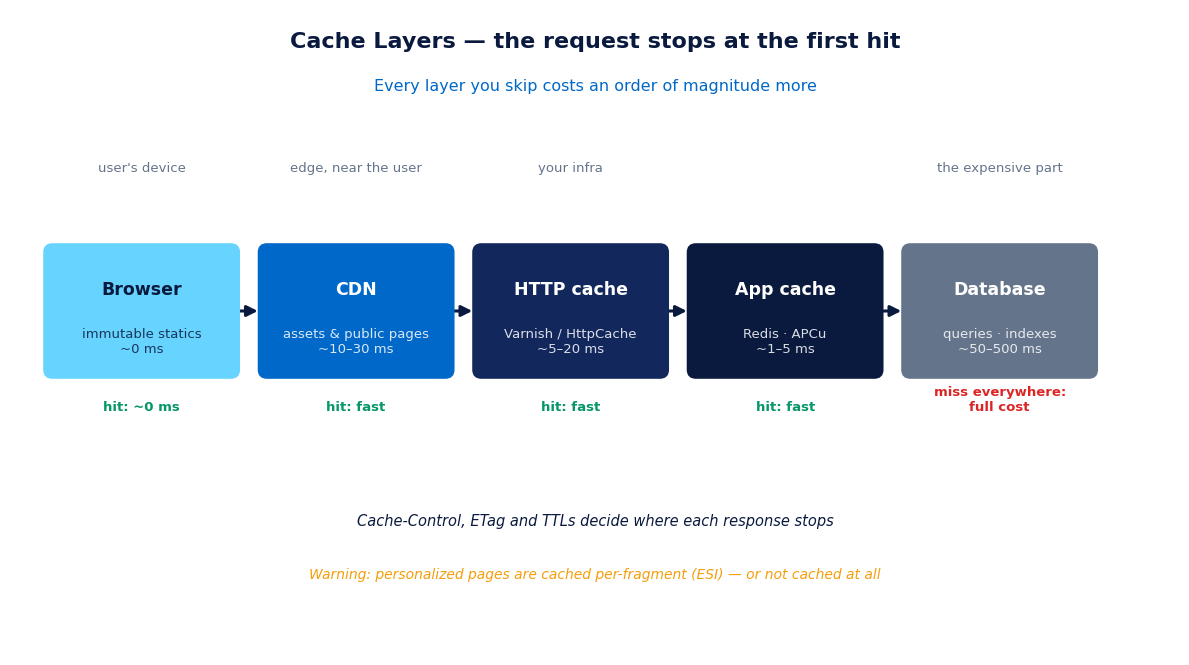
- Browser cache. Static assets with a fingerprint in the filename and
Cache-Control: immutablefor a year. Change the file, change the fingerprint, it expires by itself. - CDN. Images, CSS, JS and — if the content is public — full pages served from the point closest to the user.
- HTTP cache. Responses with
ETag,Last-ModifiedandCache-Control. In Symfony, a controller can declare its expiry in one line and let a reverse proxy (Varnish, Symfony HttpCache) serve the page without touching PHP. - Application cache. Expensive results (aggregations, third-party calls, the category menu) in Redis or APCu, with an explicit TTL.
- Database cache. The engine's own query cache and, in Doctrine, second-level cache for nearly static entities.
// Symfony: public page cacheable for 1 hour, with automatic ETag
$response = new Response($content);
$response->setPublic();
$response->setMaxAge(3600);
$response->setEtag(md5($content));
3. The PHP Runtime: Free Performance
- Up-to-date PHP. Every major version brings measurable speed and memory improvements. Running an old version means paying for performance you're not using.
- Well-configured OPcache. In production:
opcache.validate_timestamps=0, enough memory and preloading if your application supports it. It's literally free performance. - Optimized Composer.
composer dump-autoload --optimize --classmap-authoritativeat deploy time. - No heavy work inside the request. Sending emails, generating PDFs, calling slow APIs: all of that goes to a queue (Symfony Messenger) and the response goes out in milliseconds. Your user shouldn't have to wait for your SMTP.
4. The Frontend: Where Core Web Vitals Live
The backend can respond in 50 ms and still have a 6-second LCP. The usual suspects:
- Images. They're the number-one weight on almost the entire web. WebP/AVIF, device-appropriate sizes with
srcsetandloading="lazy"on everything outside the first viewport. The hero image, on the contrary:fetchpriority="high"and preloaded. - JavaScript on a diet. Audit your bundle: entire libraries imported for two functions, third-party scripts without
defer, dead code. Every KB of JS blocks interaction (INP). - Critical CSS. Inline the CSS for the first viewport and lazy-load the rest.
- Fonts.
font-display: swap, subsets and preconnect to the font origin. Fonts are a classic cause of CLS.
Common Mistakes
- Optimizing without profiling. Aggressively caching what was already fast while a 2-second query stays untouched. Profiler first, surgery after.
- Caching personalized pages at the CDN. Serving one user's cart to another is the incident nobody wants to explain. Private content gets cached by fragments (ESI) or not at all.
- Micro-optimizing PHP. Arguing
foreachvsarray_mapwhile the page runs 300 queries. Order of magnitude matters: network > database > cache > code. - Measuring only on the developer's laptop. Your fiber and your M4 are not your client's mid-range phone on 4G. RUM or you know nothing.
- Doing it once and forgetting. Performance degrades by itself: every new feature adds queries and kilobytes. Performance budgets (LCP < 2.5 s, bundle < X KB) in CI, or there are no guarantees.
The Bottom Line
Web performance is not magic or a matter of opinion: it's measuring, attacking the real bottleneck in the right order (database, cache, runtime, frontend) and setting budgets so it doesn't degrade. The wins are usually less glamorous and much cheaper than they seem: an index, a JOIN, a well-placed Cache-Control.
If your application is slow and you don't know where to start, that's exactly what we do in a performance audit: we measure the whole stack and hand you a report prioritized by impact. Request a free consultation →
Keep reading: REST vs GraphQL: how to choose the right API for your project.